Machine Learning Examples

Example values
Let’s consider the following example:
import numpy as np
from matplotlib import pyplot as plt
n=200 #  200 points
np.random.seed(13)
x1 = np.random.rand(n)
x2 = np.random.rand(n)
y = np.where(x1>x2, 1, 0) # value zero or one

fig, ax = plt.subplots(figsize = (9,6), dpi=103 )
ax.scatter(x1,x2, c=y)
plt.show()
Output:
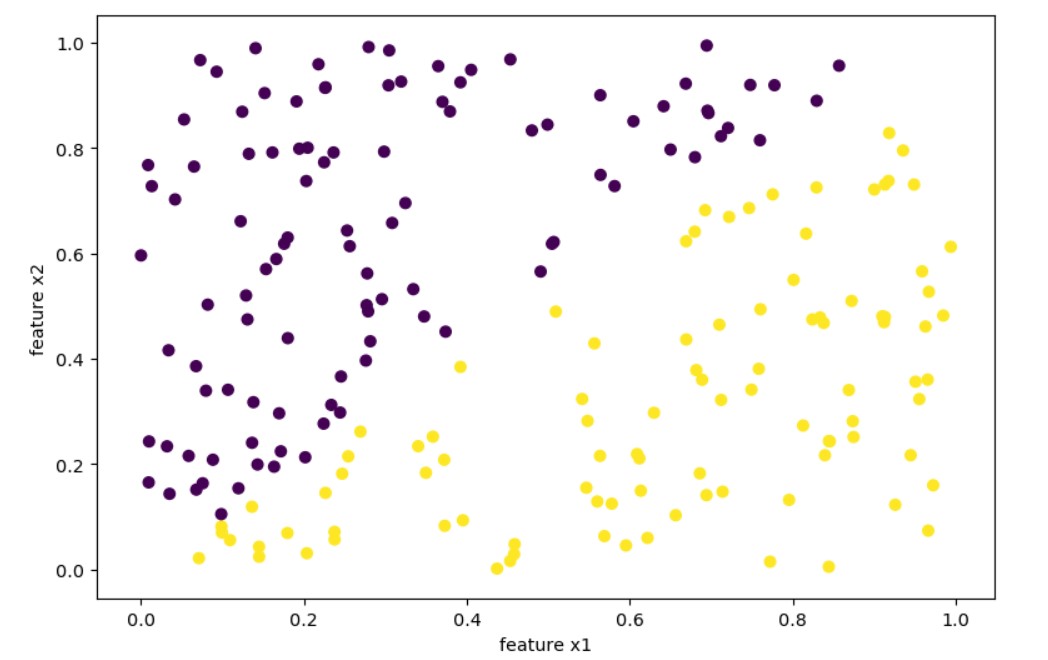
We have 200 points ( n=200 ) and we classified as 1 points $x1$ > $x2$ for the target $y$:
y = np.where(x1>x2, 1, 0)
We will try different techniques to create a prediction model that we fit with our 200 samples.
Decision Tree
Let’s use sklearn DecisionTreeRegressor first.
import numpy as np
from sklearn.tree import DecisionTreeRegressor
assert x1.shape==x2.shape
X = np.c_[x1,x2]
dtr = DecisionTreeRegressor(random_state=13, max_depth=10, criterion='mse', splitter='best')
dtr.fit(X, y)

xx = np.linspace(0, 1.0, num=50)
yy = np.linspace(0, 1.0, num=50)
xx,yy = np.meshgrid(xx, yy)

fig, ax = plt.subplots(figsize = (9,6), dpi=103 )

Z = dtr.predict(np.c_[xx.ravel(), yy.ravel()])
Z = Z.reshape(xx.shape)
ax.contourf(xx,yy, Z)
# ax.scatter(xx,yy,c=Z)
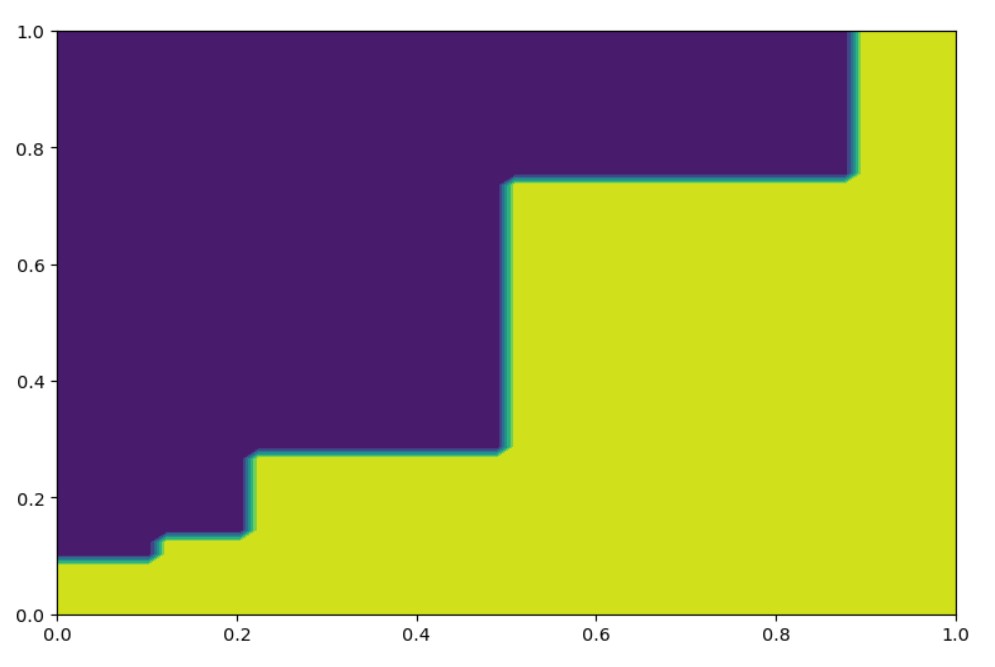
Based on a fitted dtr we may predict:
dtr.predict(np.c_[0.9, 0.1]), dtr.predict(np.c_[0.1, 0.9])
# (array([1.]), array([0.]))
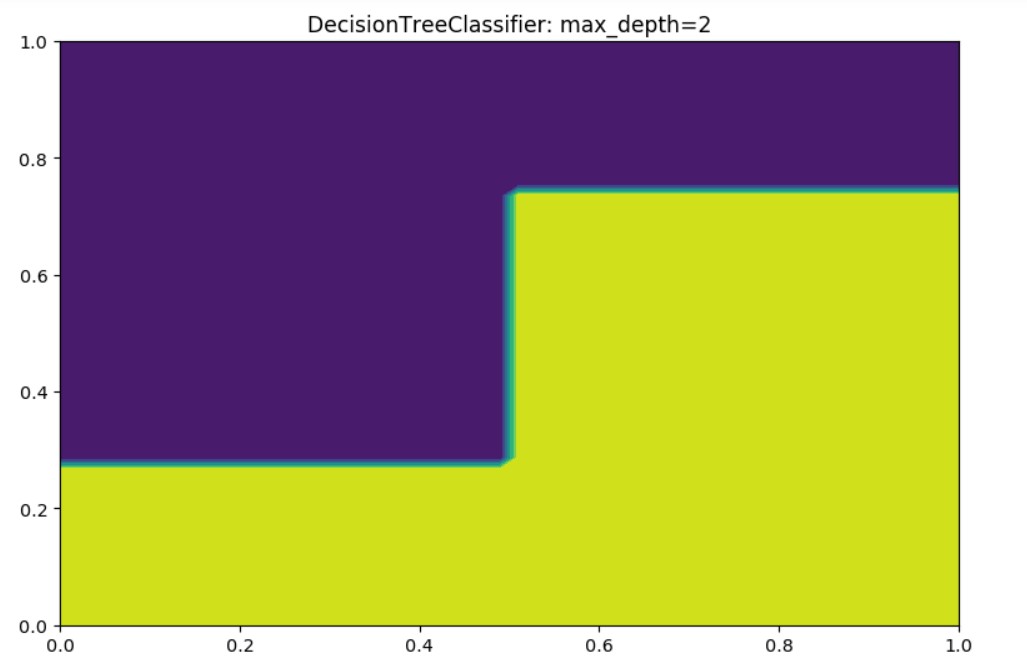
Now let’s use the DecisionTreeClassifier.
import numpy as np
from sklearn.tree import DecisionTreeClassifier
assert x1.shape==x2.shape
X = np.c_[x1,x2]
dtc = DecisionTreeClassifier(random_state=13, max_depth=2, criterion='entropy', splitter='best')
dtc.fit(X, y)

xx = np.linspace(0, 1.0, num=50)
yy = np.linspace(0, 1.0, num=50)
xx,yy = np.meshgrid(xx, yy)

fig, ax = plt.subplots(figsize = (9,6), dpi=103 )

Z = dtc.predict(np.c_[xx.ravel(), yy.ravel()])
Z = Z.reshape(xx.shape)
ax.contourf(xx,yy, Z)
# ax.scatter(xx,yy,c=Z)
Output for max_depth=2:
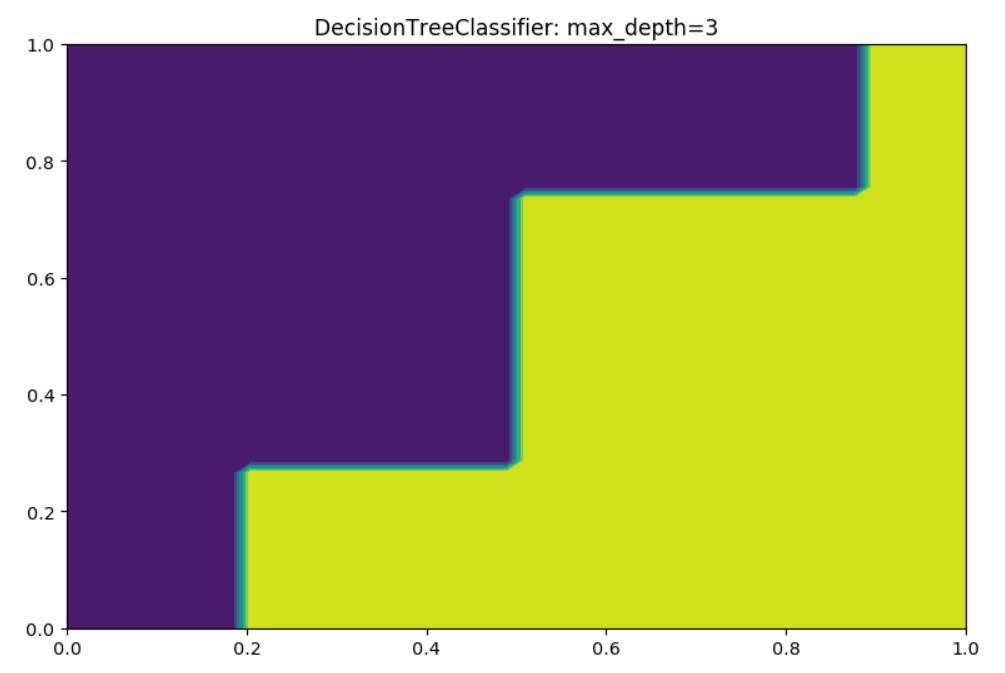
Output for max_depth=3:
Output for max_depth=4:
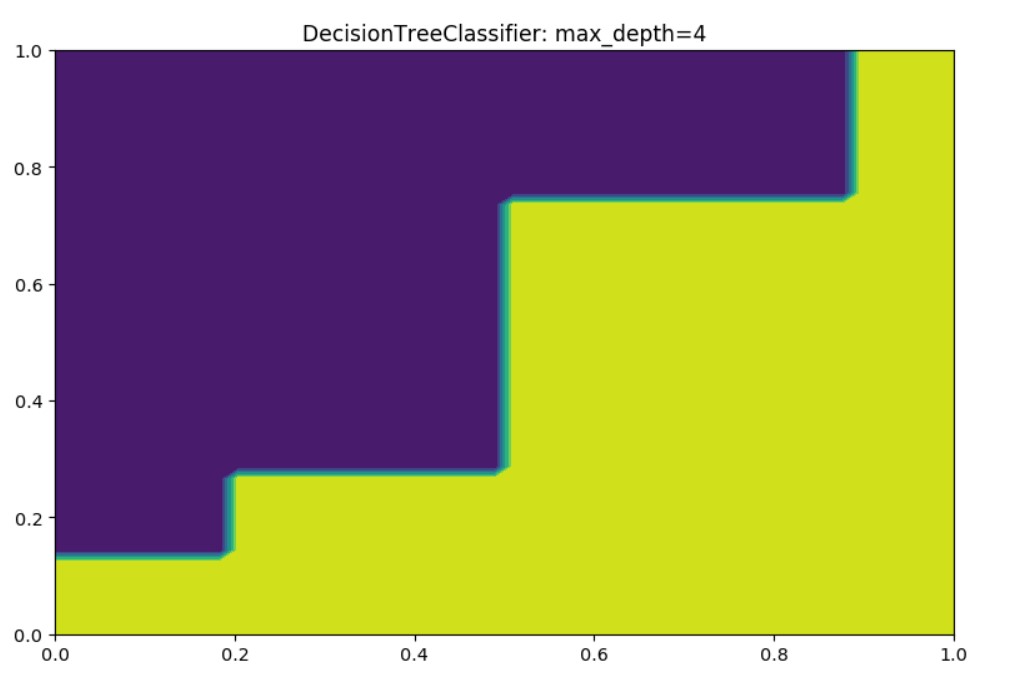
You may set different values, and find the prediction will alter. One of the most important values is n=200. If we have set more points, we will get better predictions.
Random Forest
RandomForest is a combination (sequence) of multiple decision trees.
RandomForestClassifier
We will check in here the RandomForestClassifier first.
import numpy as np
from sklearn.ensemble import RandomForestClassifier

assert x1.shape==x2.shape
X = np.c_[x1,x2]

rfc = RandomForestClassifier(max_depth=2, random_state=0, n_estimators=20)
rfc.fit(X, y)
xx = np.linspace(0, 1.0, num=50)
yy = np.linspace(0, 1.0, num=50)
xx,yy = np.meshgrid(xx, yy)

fig, ax = plt.subplots(figsize = (9,6), dpi=103 )
ax.title.set_text('RandomForestClassifier: max_depth=2')
Z = rfc.predict(np.c_[xx.ravel(), yy.ravel()])
Z = Z.reshape(xx.shape)
ax.contourf(xx, yy, Z)
#ax.scatter(xx,yy, c=Z)
Output:
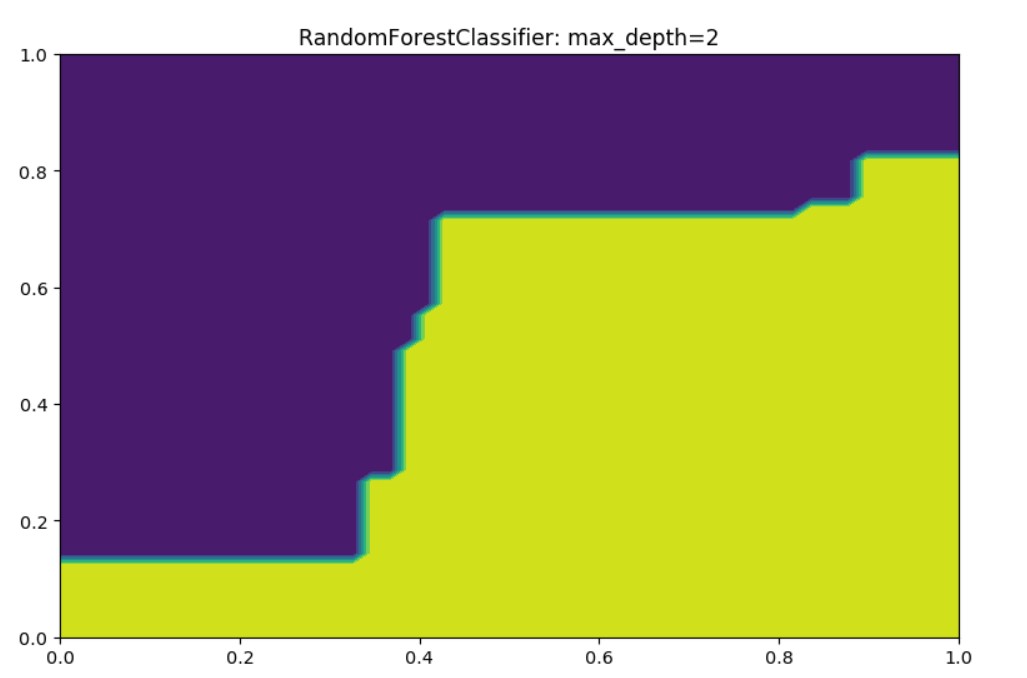
In here we may compare, we have the max_depth=2, but we also have n_estimators=20 which means 20 decision trees.
These 20 trees will impact the improvement in the results. However, you may check that the number of test samples n=200 will provide better prediction results if you increase it.
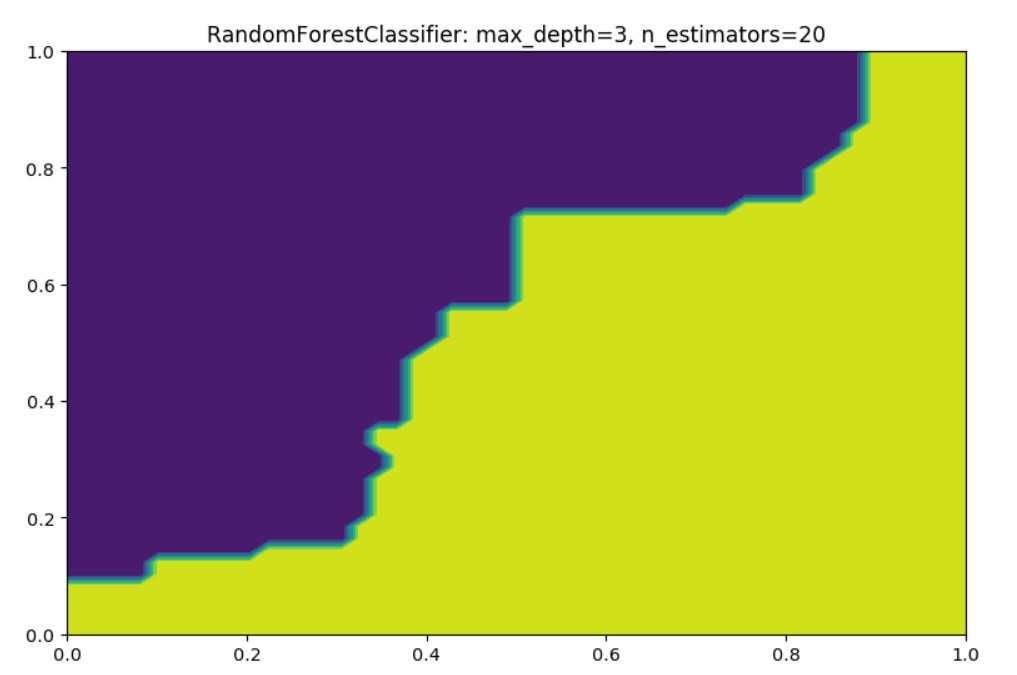
Here is how it looks for max_depth=3:
RandomForestRegressor
Let’s in here create little experiment with RandomForestRegressor
Regressor is used to predict real valued outputs which vary and don’t require outputs predicted to be in a fixed set (here 0 and 1). For example, when wanting to predict the future income of restaurants, we really don’t know all the possible outputs.
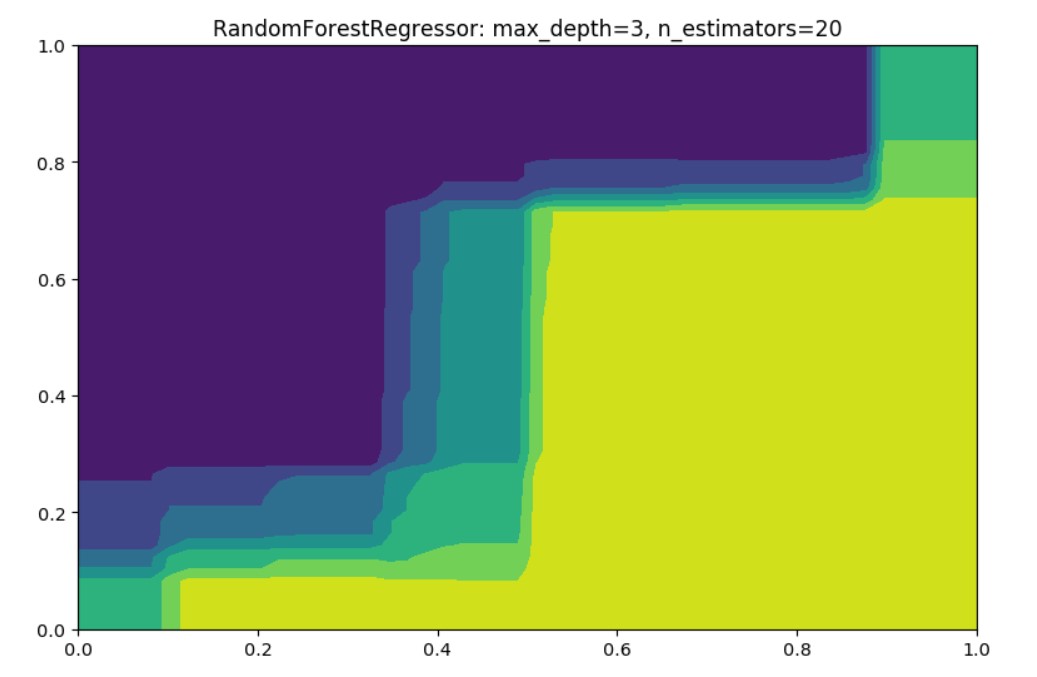
The output is as expected since now we don’t predict just the two colors, instead regressors will provide values in between calculated based on the as a weighted sum from multiple decision trees.
Logistic Regression (classification)
import numpy as np
from sklearn.linear_model import LogisticRegression


assert x1.shape==x2.shape
X = np.c_[x1,x2]
lr = LogisticRegression(random_state=13, solver='lbfgs').fit(X, y)
lr.fit(X, y)
xx = np.linspace(0, 1.0, num=50)
yy = np.linspace(0, 1.0, num=50)
xx,yy = np.meshgrid(xx, yy)

fig, ax = plt.subplots(figsize = (9,6), dpi=103 )
ax.title.set_text('Logistic Regression')
Z = lr.predict(np.c_[xx.ravel(), yy.ravel()])
Z = Z.reshape(xx.shape)
ax.contourf(xx, yy, Z)
#ax.scatter(xx,yy, c=Z)
Output:
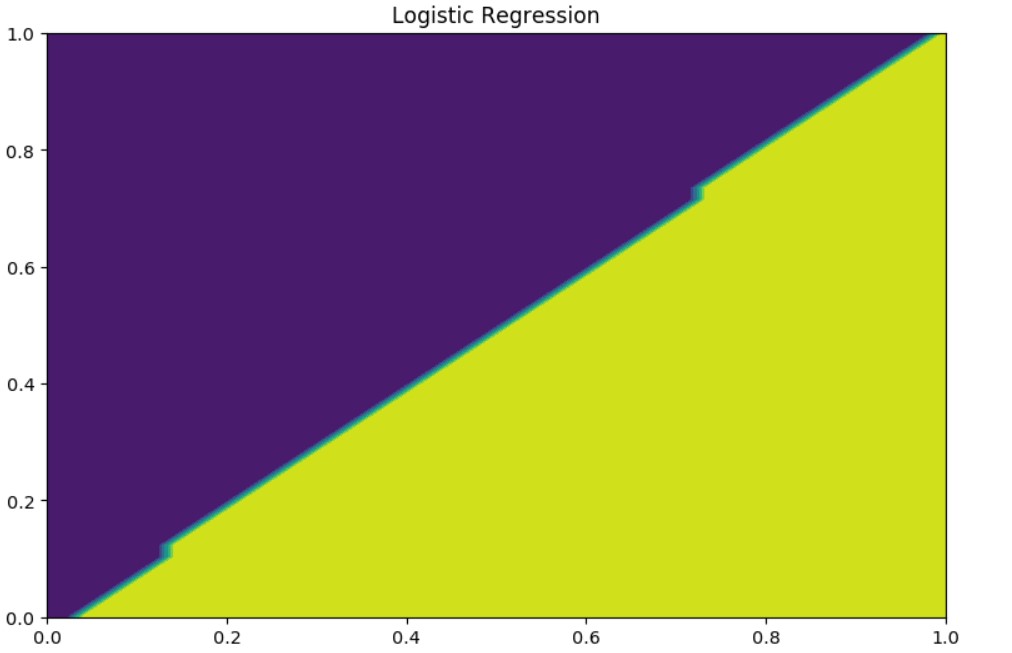
Note even though it is called logistic regression this is a classification model.
Linear Regression
Ordinary least squares Linear Regression check.
import numpy as np
from sklearn.linear_model import LinearRegression
assert x1.shape==x2.shape
X = np.c_[x1,x2]
ln = LinearRegression(normalize=True).fit(X, y)
ln.fit(X, y)

xx = np.linspace(0, 1.0, num=50)
yy = np.linspace(0, 1.0, num=50)
xx,yy = np.meshgrid(xx, yy)

fig, ax = plt.subplots(figsize = (9,6), dpi=103 )
ax.title.set_text('Linear Regression')
Z = ln.predict(np.c_[xx.ravel(), yy.ravel()])
Z = Z.reshape(xx.shape)
ax.contourf(xx, yy, Z)
ax.scatter(xx,yy, c=Z)
ln.predict(np.c_[0.9,0.1]), ln.predict(np.c_[0.1,0.9]), ln.coef_
Output:

(array([1.29900126]), array([-0.29463407]), array([ 1.02103199, -0.97101218]))
KNeighborsClassifier
import numpy as np
from sklearn.neighbors import KNeighborsClassifier
knn = KNeighborsClassifier(n_neighbors=3)
knn.fit(X, y)
xx = np.linspace(0, 1.0, num=50)
yy = np.linspace(0, 1.0, num=50)
xx,yy = np.meshgrid(xx, yy)
fig, ax = plt.subplots(figsize = (9,6), dpi=103 )
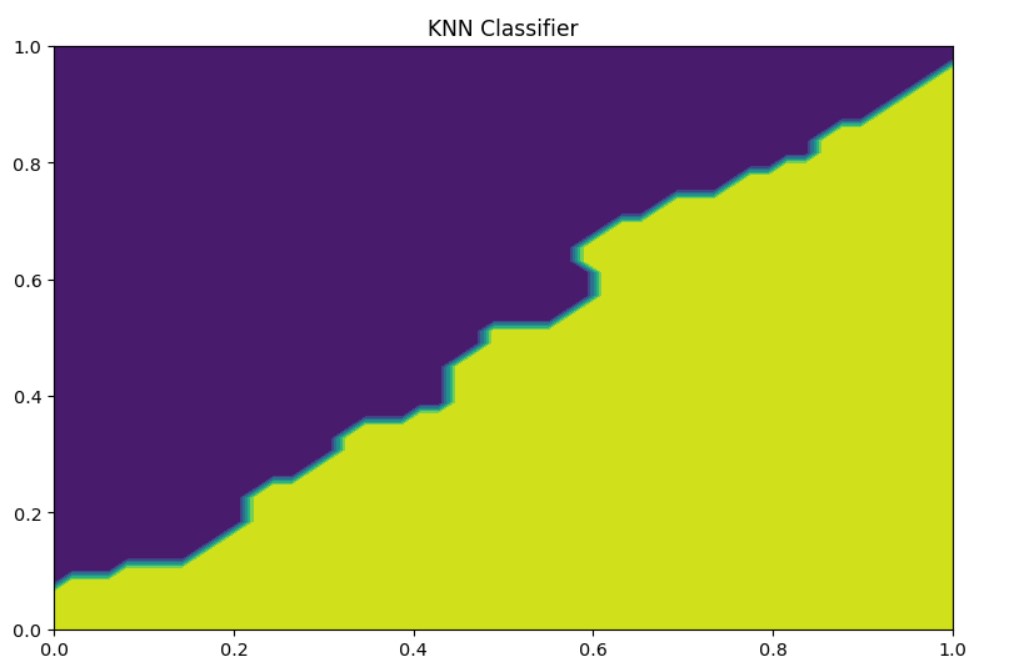
ax.title.set_text('KNN Classifier')
Z = knn.predict(np.c_[xx.ravel(), yy.ravel()])
Z = Z.reshape(xx.shape)
ax.contourf(xx, yy, Z)
#ax.scatter(xx,yy, c=Z)
Conclusion
Here we provided an overview for the simple classification problem with two features $x_1,x_2$.
We found out that LogisticRegression model is the best fit for this problem.
The LinearRegression won’t help us here, but we found interesting intuitions.
There are many different problems and many other prediction models. You may also check KMeans clustering on this problem.
…
tags: random forest - decision tree - linear regression - logistic regression & category: machine-learning