Data Analyst Interview Questions in R

Table of Contents:
- What is R used for?
- What is RStudio?
- General Machine Learning questions
- Datasets in R
- Packages in R
- Variables in R
- Functions in R
- Working with Files in R
- Reproducibility
- Tidyverse
What is R used for?
R is a programming language used for data manipulation and data visualization. Part of the R legacy is its excellent graphing quality. To create R graphs check R for Data Science on data visualization.
What is RStudio?
RStudio is an integrated development environment for R. There are two forms or RStudio:
- RStudio Desktop
- RStudio Server (accessed from a web browser)
You can also run R on Google Colab.
RStudio is open source and includes many open source software components such as: Qt, Ace, Boost, RapidXml, JSON Spirit, Google Web Toolkit, Guice, Hunspell , pdf.js, SyncTeX, ZLib, highlight.js, MathJax.
RStudio is also the name of the organization behind RStudio tools.
General Machine Learning questions
What is the difference between Data Mining and Data Analysis?
Data Mining is a process of collecting the data where Data Analysis is a process of understanding (interpreting) the data in some way.
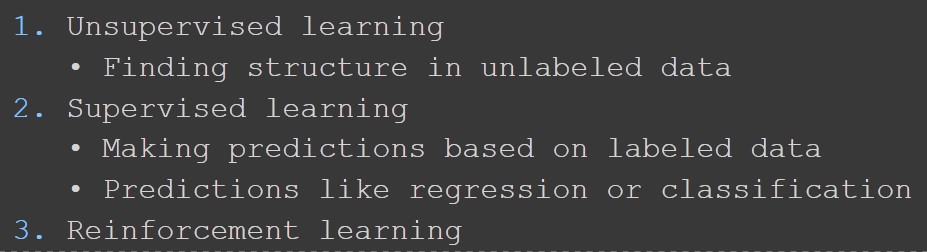
What are three major Machine Learning types?
Datasets in R
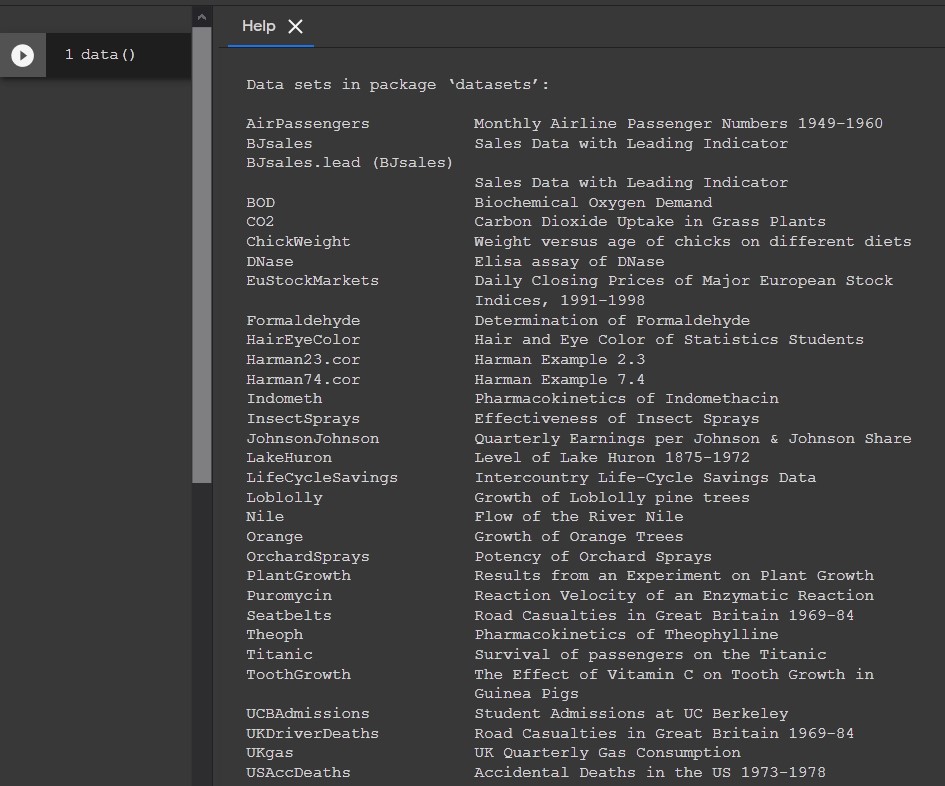
What is the output of data() command?
This command will list all the datasets from the package datasets, same as data(package="datasets").
These datasets are also called preloaded datasets.
As I am using at the moment RStudio version 3.6.2 (nickname Dark and Stormy Night), here is the list of the datasets.
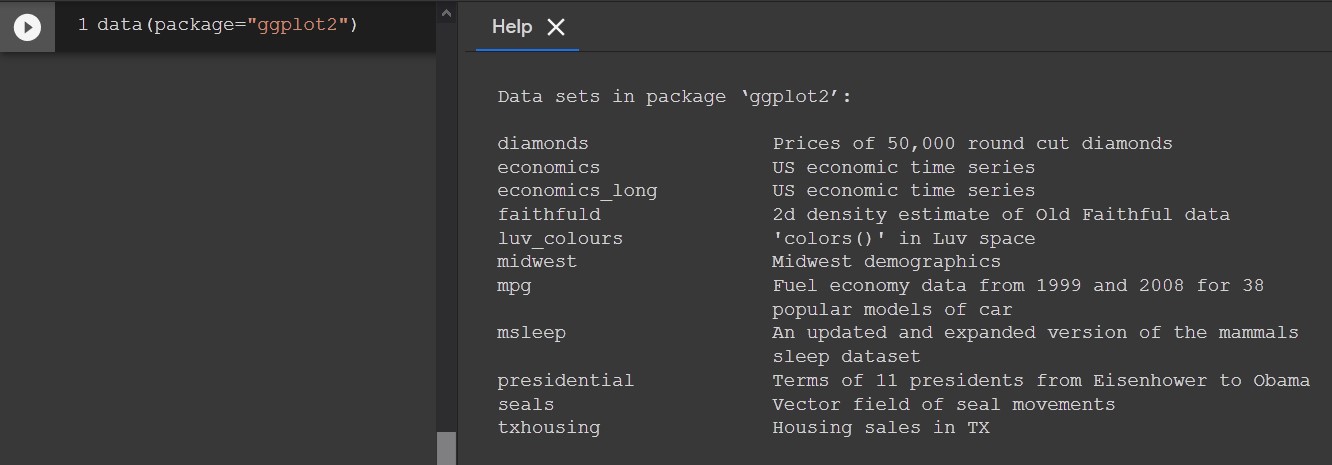
How to list datasets inside specific R package?
To list all the datasets from the package ggplot2 you would use: data(package="ggplot2").
Packages in R
How to list all available packages in R?
.packages returns information about package availability.
.packages(all.available = TRUE, lib.loc = NULL)
What is .libPaths()?
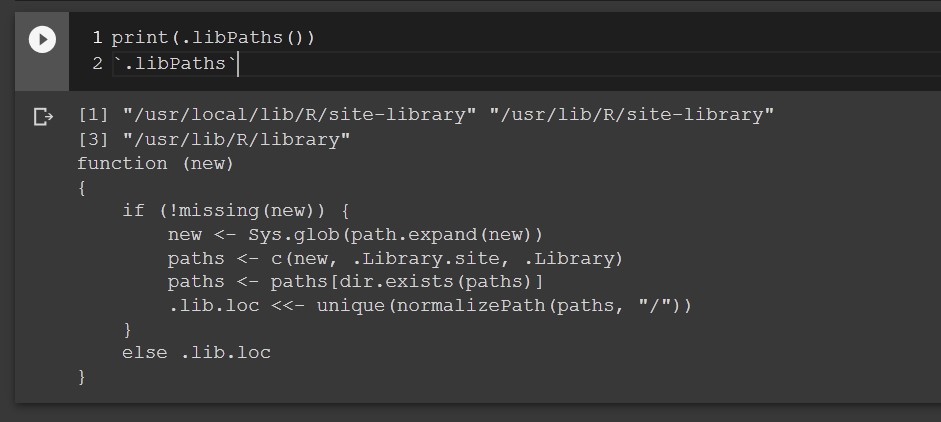
.libPaths() will list default locations where to search for the packages.
What is the difference between p1 and p2?
p1 = .packages()
p2 = .packages(all.available = TRUE, lib.loc = NULL)
First .packages() returns the names of the currently attached packages, while second shows the character list of all available packages.
lib.loc=NULL means search the .libPaths() for packages.
To load a package to the list of attached packages you call library:
Example:
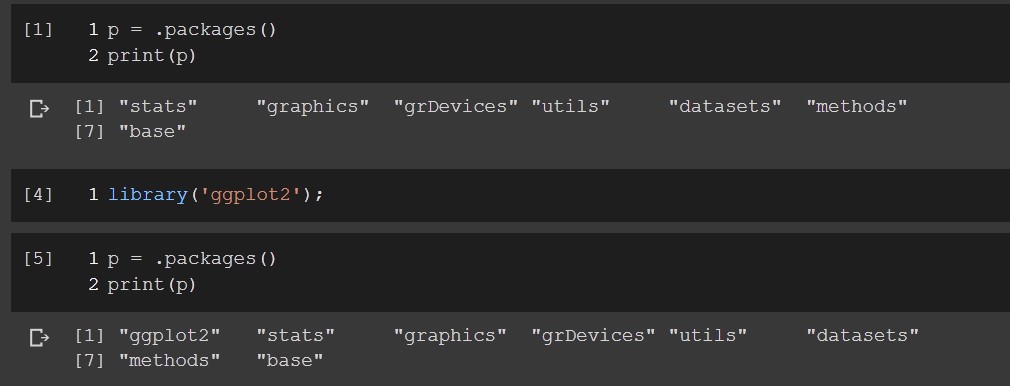
What will happen?
if (!require('ggplot2'))
install.packages('ggplot2');
library('ggplot2');
This will load the ggplot2 package. gg means “Grammar of Graphics”. You provide the data, tell ggplot2 how to map variables to aesthetics, what graphical primitives to use, and it takes care of the details.
ggplot2 is part of the tidyverse package. tidyverse package most likely will be part of your R everyday toolbelt.
Explanation:
require will return TRUE if the package is installed else FALSE.
library returns an error if the package is not installed, or load the package. install.packages installs the package by name.
Variables in R
Will .a appear in ls()?
a<-1
.a<-1
ls()
No. Prefix dot in R specifies a hidden object that cannot be accessed directly through ls unless you use ls(all.names = TRUE).
What is the preferred way to assign a variable in R?
x <- 9 # 1
9 -> x # 2
x = 9 # 3
Non of the assignments above is forbidden. Meaning you can use any of these based on your personal preference. Still, there are assignment operators differences and some think the #1 approach (from right to left) is the best way to go.
To glue “hello” and “world” what would you use?
paste("hello", "world") # 1
glue("hello", " world") # 2
"hello" + " world" # 3
"hello" . " world" # 4
paste("hello", "world", sep=" ") # 5
The correct would be way is 1 and 5, but 1 is simpler.
Arrays vs. Matrices in R. What is the difference?
Arrays can have any number of dimensions while matrices are two dimensional.
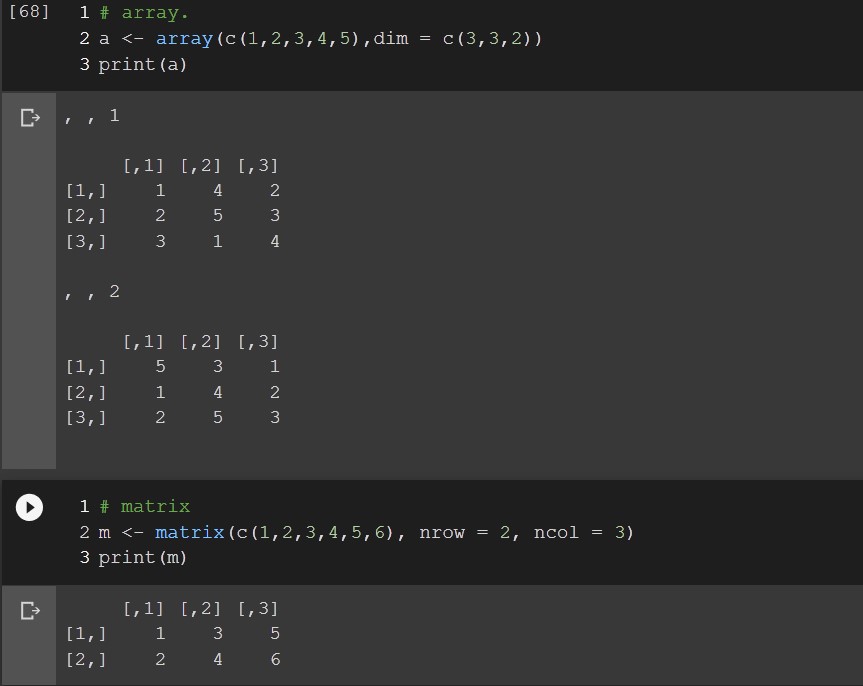
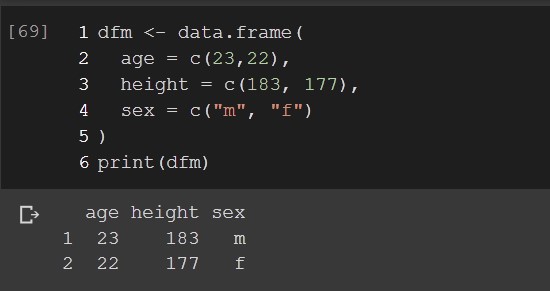
Dataframe vs. Matrix in R. What is the difference?
In dataframe separate columns can be of different type. Matrix on the other side has the same type for all elements.
Create dataframs using
data.frame()function.
age height sex
23  183    m
22  177    f
dfm <- data.frame(
  age = c(23,22),
  height = c(183, 177),
  sex = c("m", "f")
)
print(dfm)
Functions in R
Which one you would use?
f1 <- function(a, b){ a + b }

f2 <- function(a, b){
    return a + b
}
f3 <- function(a, b){
    return (a + b)
}
f2 is bad, won’t work and f1 is an example of an implicit style where you don’t use return (not recommended): Google R Style guideline.
So the f3 should be the way you go.
Some recommendations may even be promote implicit returns.
Should you define a function called c()?
No. c() is reserved function to combine the elements into a vector.
Working with Files in R
You need to read data.csv file that looks like this:
age height sex
23  183    m
22  177    f
How would you load this file?
data <- read.csv("data.csv", header = TRUE) #1
data <- read.table("data.csv", header = TRUE) #2
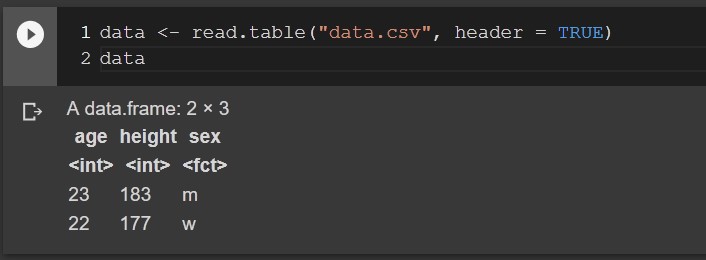
Correct would be to use read.table. This file is not in CSV format. The extension is wrong. For the plain textual files use the read.table, for the csv files use read.csv.
Note this was a trick example
Reproducibility
How to create an example in R that others can reproduce?
To make an example in R for others to reproduce, you need to set:
- a dataset
- code to reproduce the results including installation of the needed packages.
- R version info (in some cases)
- The seed
set.seed()(in some cases)
Tidyverse
What is tidy data?
It is a way to organize your data with the tidyverse package:
if (!require("tidyverse"))
install.packages("tidyverse");
library("tidyverse");
Tidyverse has some rules where:
- each variable must have its own column.
- each observation must have its own row.
- each value must have its own cell.
What are the tidyverse required packages?
You get the answer to this question with this request:
help(package="tidyverse")
Search for the text where it reads Imports:
Imports:
broom (>= 0.5.2), cli (>= 1.1.0), crayon (>=1.3.4), dbplyr (>= 1.4.2), dplyr (>= 0.8.3), forcats (>= 0.4.0), ggplot2 (>= 3.2.1), haven (>=2.2.0), hms (>= 0.5.2), httr (>= 1.4.1), jsonlite(>= 1.6), lubridate (>= 1.7.4), magrittr (>= 1.5),modelr (>= 0.1.5), pillar (>= 1.4.2), purrr (>=0.3.3), readr (>= 1.3.1), readxl (>= 1.3.1), reprex(>= 0.3.0), rlang (>= 0.4.1), rstudioapi (>= 0.10),rvest (>= 0.3.5), stringr (>= 1.4.0), tibble (>=2.1.3), tidyr (>= 1.0.0), xml2 (>= 1.2.2)
…
tags: interview - questions - data - analyst - R - answers & category: r