Poisson distribution in R | Example

Poisson distribution is discrete distribution that describes the number of events occurring in a fixed time interval or region of opportunity in general case.
Requires only one parameter $\lambda$ also know as the expected number of events.
This $\lambda$ is the number of events that will occur in this fixed time interval or région d’opportunités.
Support of this function is 0 and $\infty$, or it is bounded on the interval $[0,\infty)$.
As a difference to the binomial distribution, the Poisson distribution goes to the $\infty$.
Pre requisites
- Constant number of events in constant time interval
- Events occur in sequence (timeline)
- The occurrence of one event doesn’t affect the subsequent event (independence)
PMF
The probability mass function $f$:
where $x \in N_0= {0,1,2, …, \infty}$ is the support.
CDF
$\mathbb{P}(\mathbf{X} \leq \mathbf{x})=\Large \frac{\Gamma(\lfloor x+1\rfloor, \lambda)}{\lfloor x !\rfloor}$
Moments
$\mathbb{E}(X)=\lambda$
$\operatorname{var}(X)=\lambda$
R code to use Poisson distribution
We can use the following R functions for Poisson distribution calculus:
dpois(x, lambda, log = FALSE)ppois(q, lambda, lower.tail = TRUE, log.p = FALSE)qpois(p, lambda, lower.tail = TRUE, log.p = FALSE)rpois(n, lambda)
These are density, distribution function, quantile function and random generation for the Poisson distribution with parameter $\lambda$.
Example: For $\lambda=3$ plot the Poisson distribution for x={0, 1,…, 20} interval.
x <- 0:20
plot(success,dpois(x,lambda=3),
     type='h',
     main='Poisson Distribution (n=20, lambda=0.3)',
     ylab='Probability',
     xlab ='# Successes',
     col='yellow',
     lwd=10)
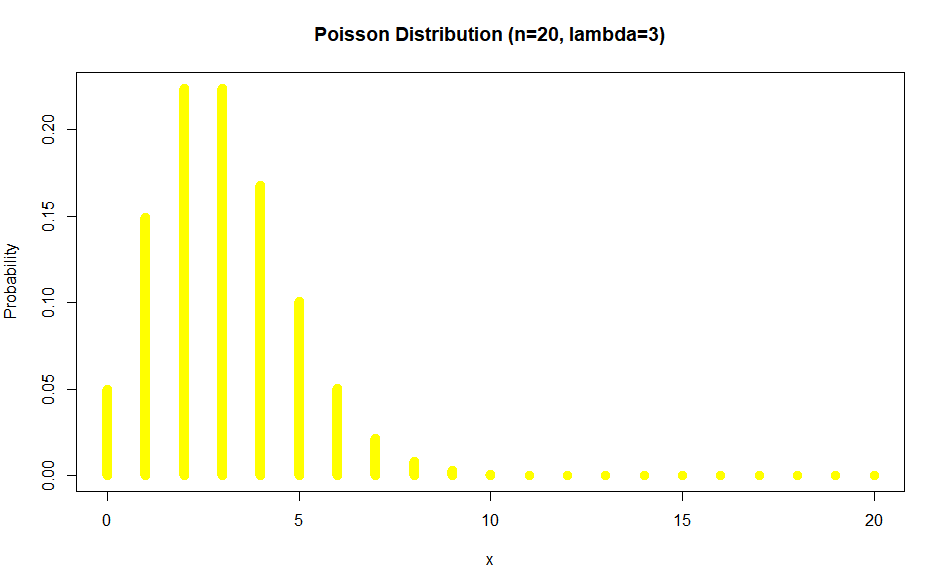
To get the probability at x=0 we would ask: ppois(0,lambda=3):
Out:
0.04978707
To get the probability at $x=1$ we may ask ppois(1,lambda=3)-ppois(0,lambda=3):
Out:
0.1493612
Of course dpois(x,lambda=3) would aslo give us:
Out:
4.978707e-02
1.493612e-01
2.240418e-01
...
Which is exactly what we showed.
Example: Different values of lambda
…
tags: poisson & category: r